Brief
Wellington City Council needed a defensible, city-wide way to make the journey to school safer — across all 81 schools, with limited budget and a need to show why each intervention was prioritised the way it was.
What we did
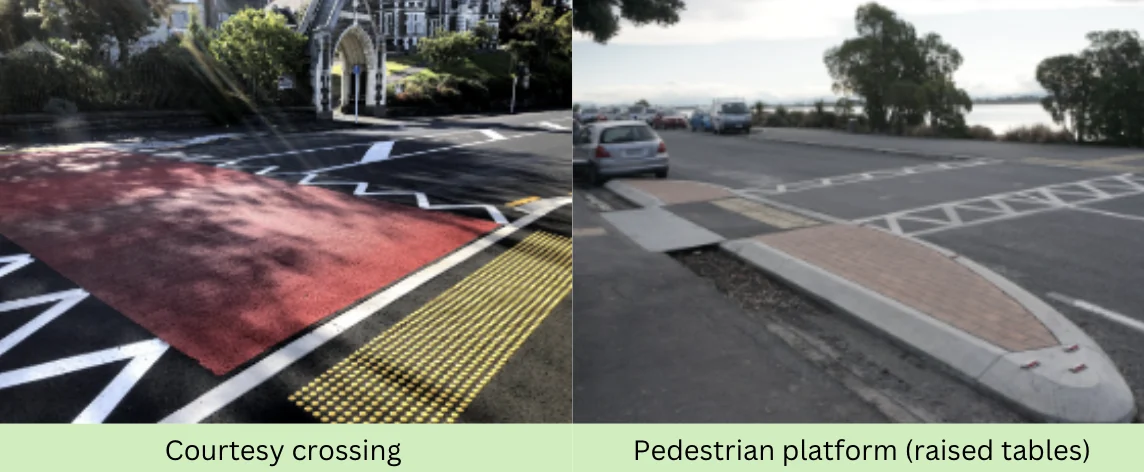
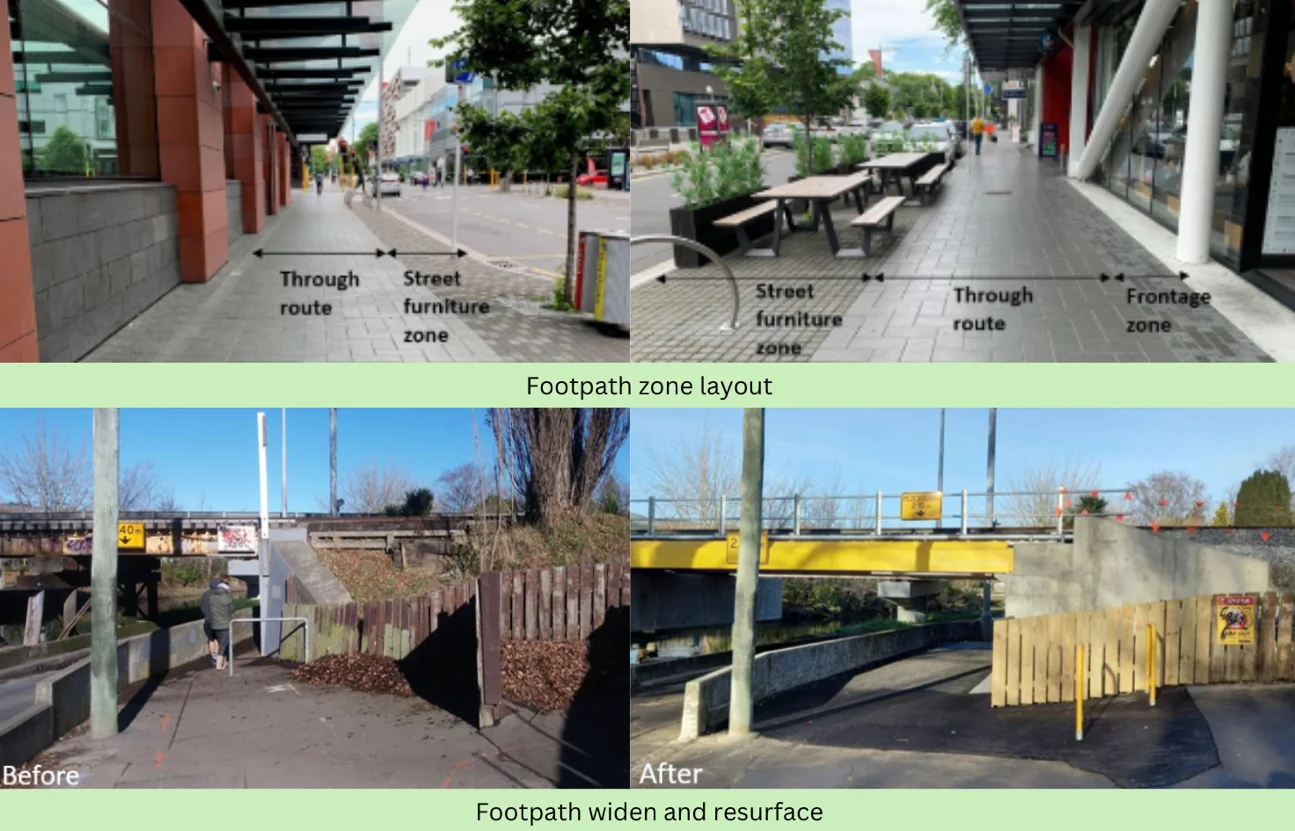
TTAP has run the programme as a staged pipeline since 2024: a desktop prioritisation of all 81 schools (built on NZTA Crash Analysis System data and operating-speed data, presented through a Power BI dashboard), then site audits at the higher-risk schools, then optioneering and a shortlist, and finally crossing, signage and traffic-calming design for the schools that warranted it. A December 2025 sensitivity test on refreshed crash and speed data re-graded several schools and drove the next design package. The programme runs with a joint communications and engagement plan with the Council.
Outcome
A repeatable desktop-to-design methodology that lets the Council prioritise school-safety investment across the whole city on the evidence — and take each intervention from a defensible risk ranking through to a buildable design.